
ML-Based Glioma Classification
ML-Based Glioma Classification
ML-Based Glioma Classification
Feb 8, 2024

Optimizing Glioma Grading: Leveraging Clinical and Mutation Features for Accurate Diagnosis
Shreyas Sreenivas
Aishwarya Belakavadi Subrahmanya
PERFORMANCE EVALUATION AND INTERPRETATION
Having decided what models can be built for the churn prediction, let’s bring our focus to the performance of these models namely Logistic Regression, Decision Tree, k-Nearest Neighbors, Decision Tree Classifier and Random Forest Classifier.
Logistic Regression:
Implementing the Logistic Regression, we got the accuracy score, F1 score, confusion matrix as shown below:


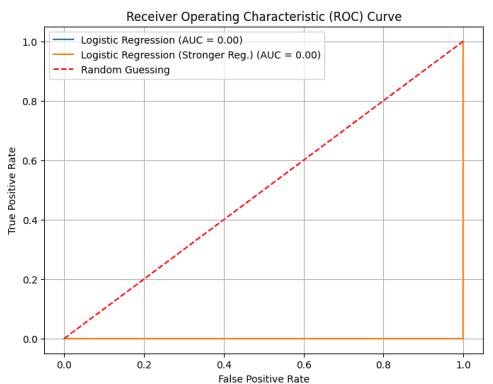
The following ROC curve has been plotted to further review the performance of the classifier.
Decision Tree:
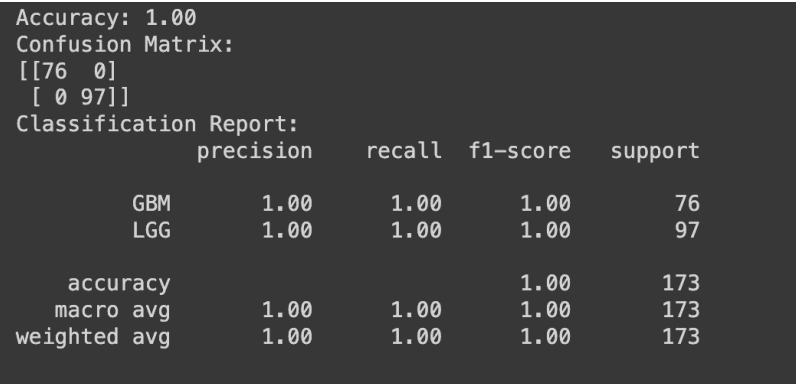
Implementing Decision Tree, we got the following performance evaluation:
kNN:
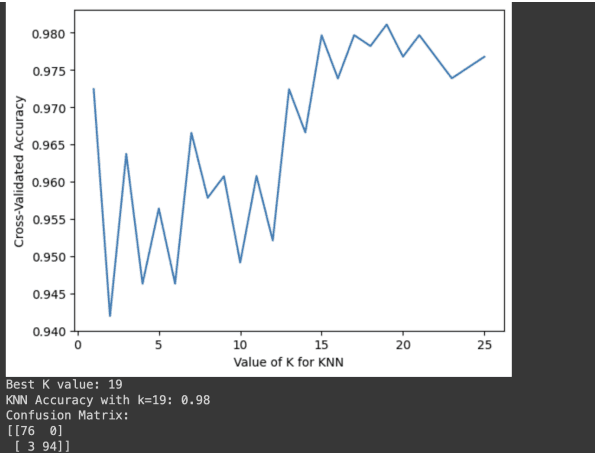
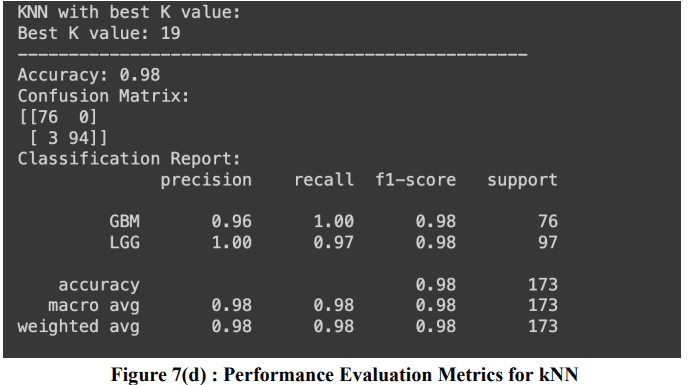
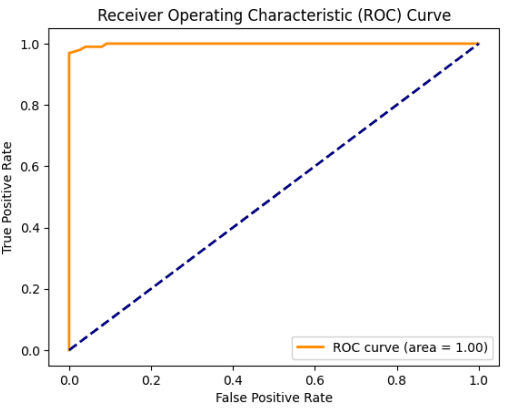
Performance evaluation of kNN-
The following ROC curve has been plotted to further review the performance of the classifier.
SVM
Performance evaluation of SVM model-
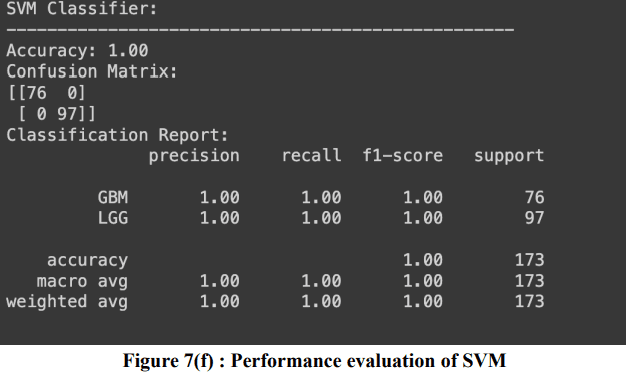
ROC graph-
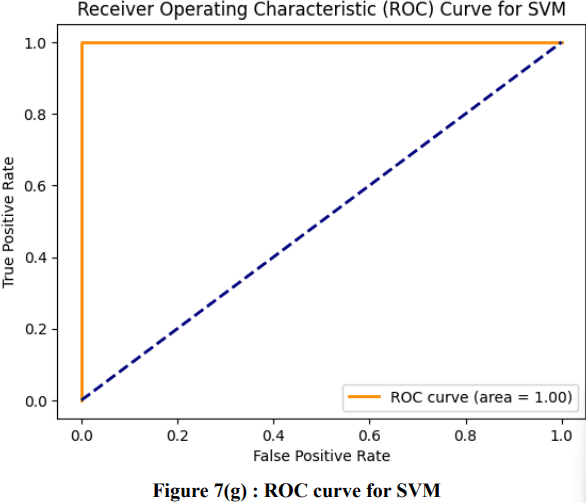
Random Forest Classifier:
Performance evaluation of SVM model-
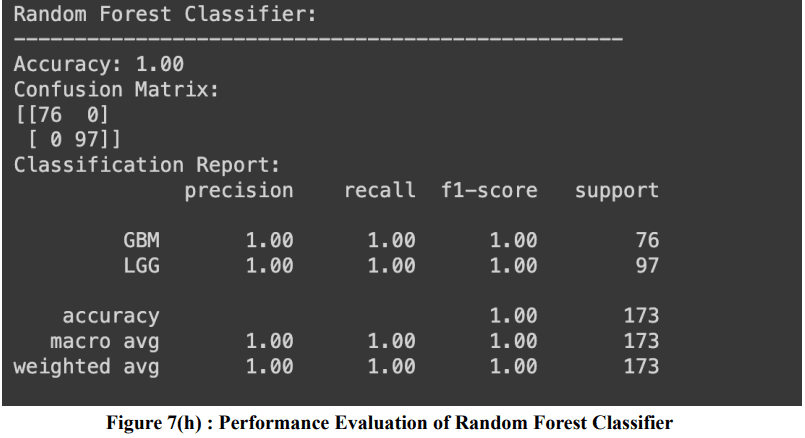
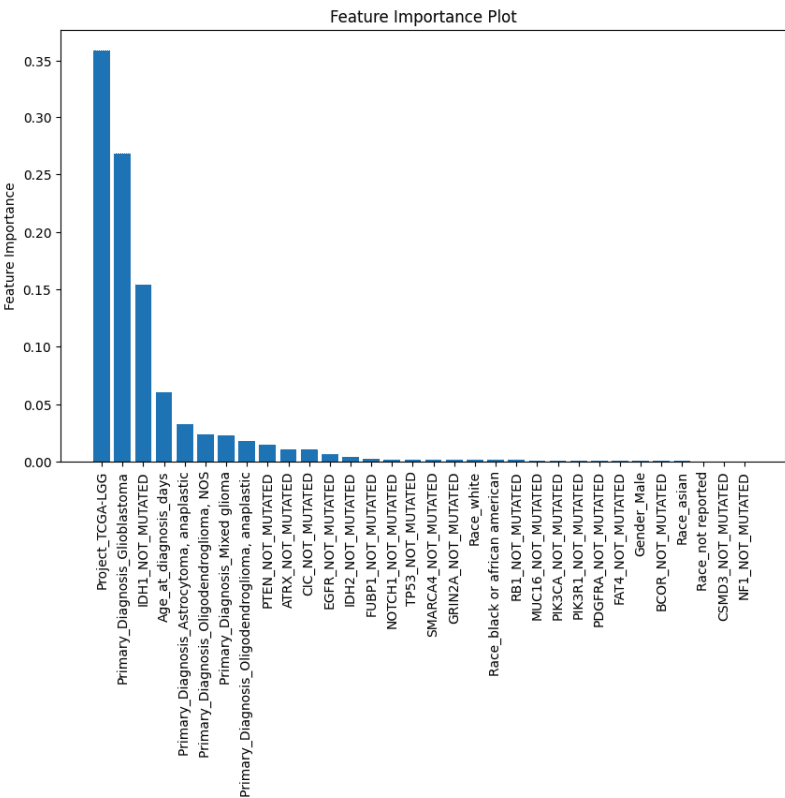
Feature Importance plot of Random Forest Classifier-
Gradient Boosting
Performance evaluation of Gradient Boosting model-

Multinomial Naive Bayes
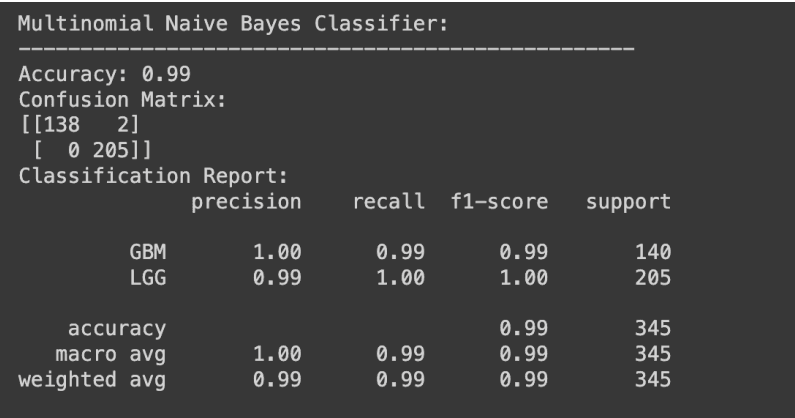
Performance evaluation of Multinomial Naive Bayes model-
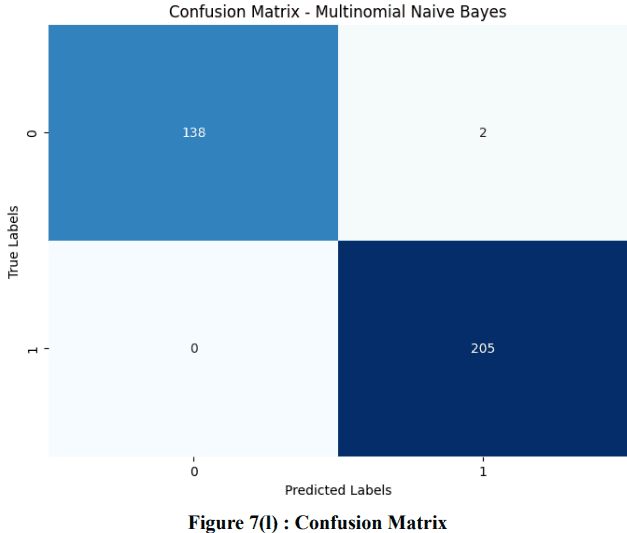
Confusion matrix of the model-
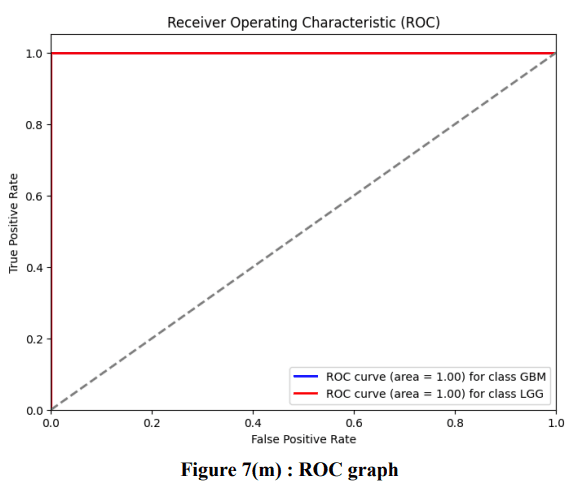
ROC graph-
Best Performing Model:
From the above performance evaluation section, we can conclude that the following models are the best performing models,
KNN (98%)
Multinomial Naive Bayes (MNB) (99%)